Trump-Russia Network

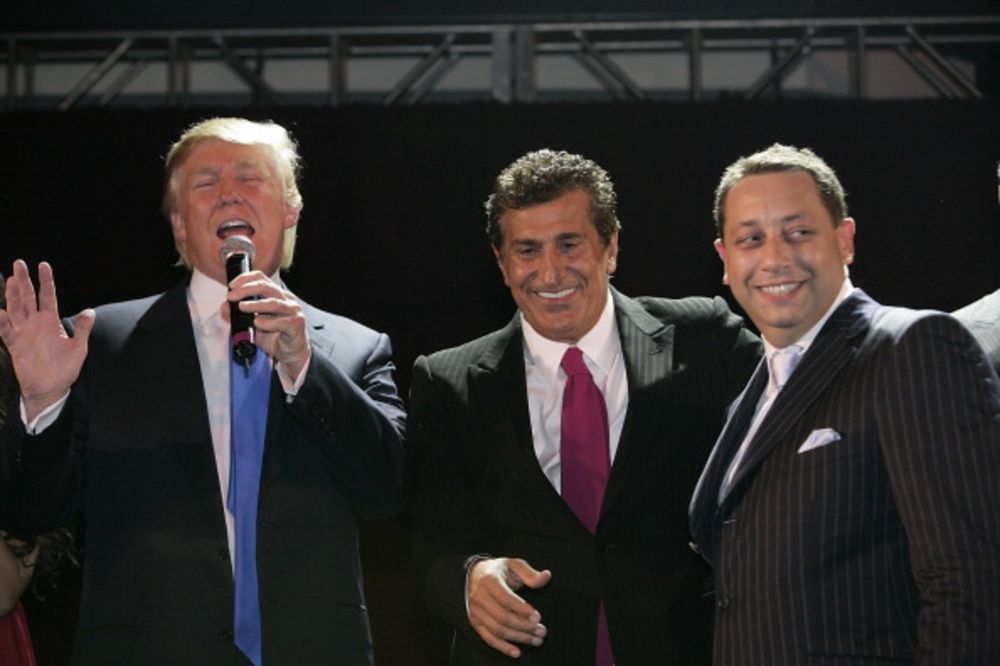
Donald Trump, Tevfik Arif, and Felix Sater at 2007 Trump Soho launch party (Source: Bloomberg).
Plotting the Trump-Russia Network
We are a group of political science PhD students at the University of North Carolina-Chapel Hill who set out to plot the decades-long network of relationships between Donald Trump and Russian actors connected to Vladimir Putin. Using attorney and professor Seth Abramson’s 2018 book Proof of Collusion as our data source, we hand-coded over 300 “nodes” (actors and organizations) and approximately 700 connections between them. Our aim was to see if constructing such a plot could be a useful tool to visualize the political developments described in the book’s narrative and its 300+ characters and to gain additional insights into the nature of their relationships. Our efforts build on a growing body of literature in political science utilizing network analysis to examine the role of social and political relationships, interdependency, and structural power in political outcomes.
This website provides the main results of this effort, i.e. the interactive dynamic and static network plots, as well as additional analysis and the data and code required to replicate the plots.
If you use the data or analysis in your work, please cite as:
- Case-Ruchala, D. (2020). Trump-Russia Network Data & Analysis. Retrieved from https://devincr.github.io/trumpnetwork.
Why Proof of Collusion?
Of the many tell-all books available to choose from when we started this project in the fall of 2019, we chose Abramson’s (2018) Proof of Collusion given its focus on the deeper roots of Donald Trump’s connections to Russia. Proof of Collusion is based entirely on publicly available information (primarily news stories and legal documents) on Trump’s connections and interactions with Russian affiliates. As a data source, Proof of Collusion provides us with a decades-long account of Trump’s political and economic connections with Russians. This includes only those connections that have been reported and verified in the press and that Abramson included in his account, so the network we present is reliant on the accuracy and representativeness of those accounts. It should therefore not be considered a complete visualization of the network of relationships between Trump and Russian affiliates; rather, it is limited to those described in the book.
Dynamic network plot (1973-2019)
The dynamic network plot plays the evolution of relationships over time, beginning in 1973 and ending in 2019.
The plot has several interactive features:
- Clicking a node lets you view the name of the person and their country affiliation
- Clicking a link between nodes lets you view text from the book about the relationship (with years of interaction and page numbers included).
- Double clicking a node will keep the node highlighted and label as the plot plays
Click to view the dynamic network
Static network plots
The static network plots below show the same nodes and connections as in the dynamic plot but at particular time periods (as of 1990, 2000, 2005, 2010, and 2019). The plots for particular time periods were created by subsetting the full network to only include the nodes/links in the network as of that particular year.
The plots have several interactive features, some additional to the dynamic plot:
- Clicking on the nodes and links again provides information about the nodes/links
- Selecting a node on the plot highlights that node and its closest connections
- Selecting a node from the dropdown menu (alphabetized) will highlight that node and its closest connections
- Nodes can be moved around for better visualization
Click to view the 1990 static network
Click to view the 2000 static network
Click to view the 2005 static network
Click to view the 2010 static network
Click to view the 2019 (full) static network
Replication guide: methods, code, & additional analysis
Click here to view a short replication guide that provides more information about:
- How we compiled the data from the book
- The code used to create the plots
Click here to view a short document providing additional analysis using network statistics to analyze the network. Code is provided to supplement the above guide.
Download our data & replication files
A .zip file of our data and replication code can be found by clicking “View the Project on Github” to the left and downloading “replication.zip”.